[Code changed slightly on 27.1.12 so the image draws sequentially across the page. Working best in Chrome.]
Home
Refresh page
Click to zoom in on a point, or click and drag to zoom in on a region.
Click to change zooming in or out. [Use single clicks when zooming out.]
Change the colour scheme
You can reset the size of the canvas (the aspect ratio is kept the same).
You can reset the maximum iteration depth. Values between 200 and 2000 work well.
The boxes below show the x and y coordinates of the centre of the image, and the current zoom. You can also enter new values in these boxes and click "Set coordinates and zoom" to change them manually.
Click and drag on the image for a zoom of that region. A rectangle will show your zoom area. The aspect ratio is not fixed, but the width stays as 500 pixels unless you change the width box. You can also zoom in by a factor of 4 on any point by clicking on that point. Selecting large areas of black will slow the calculations down, except for the main cardioid and big circle to its left, which are immediately coloured black. If you find black areas begin to have smooth boundaries, increase the maxiumum iteration depth (values over 2000 may lead to very slow processing). After many consecutive zooms the image becomes grainy. This is because the x and y coordinates of where you're looking have too many decimal places and are being rounded.
This tool allows you to try out different spectrums of colours in the Mandelbrot set.
Input values between 1 and 255. The colours will change as you move the mouse over the square. When clicked, that shade will be presented in the rectangle below and will not change until the next click. The minimum value will be associated with the x coordinate and the value of that colour will vary from your value up to 255. The second smallest value will be associated with the y coordinate and the value of that colour will also vary from your value up to 255. The largest value will not change.
You can generate a spectrum of colours, with between 2 and 6 selected colours. The spectrum will move smoothly (linearly through rgb shades) between each chosen colour, cycling back to the first. 50 shades are generated between each colour chosen. For example, if you choose three colours, the colours of your first three clicks will be selected to create a spectrum of 150 shades. After the third click the spectrum will show below the colour square. You can then return to the top of the page to click on the 'Your colour scheme' button. [It's worth exploring colour schemes with three contrasting colours, spread over 600 or 900 shades, by setting 200 or 300 shades between each colour.]
If you really love your colour scheme, you can record the rgb values of the colours you chose. Clicking this button will display the colours. Write them down, and re-use them in the future!
The images are created using HTML5 'canvas' and javascript. Your browser gets the javascript and runs it, using your cpu time, rather than the web server's cpu time. Unfortunately the canvas image can only be saved using printscreen. A copiable PNG of the same image is placed at the bottom of this page which can be right-clicked and saved or copied.
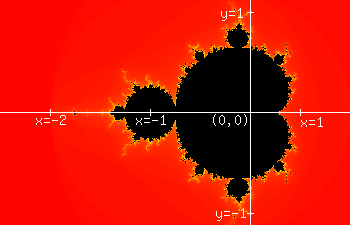
The Mandelbrot set is a region of the two-dimensional plane which satisfies a simple rule: any point c in the plane is in the Mandelbrot set if zn+1 = zn2 + c converges as n tends to infinity (starting with z0 = 0).
However, in fact the plane is the complex plane, where the y-axis represents the imaginary part of the complex number, and the x-axis represents the real part of the complex number. For example, z = -1.75 + 0.2i would be plotted as (-1.75, 0.2). The rules for arithmetic with complex numbers are applied when checking to see if the sequence given above converges. The following diagram shows the complex coordinate axes and the Mandelbrot set.
This link leads to a 1-D analogue and explanation of this process, which may help to clarify what is going on: 1-D analogue
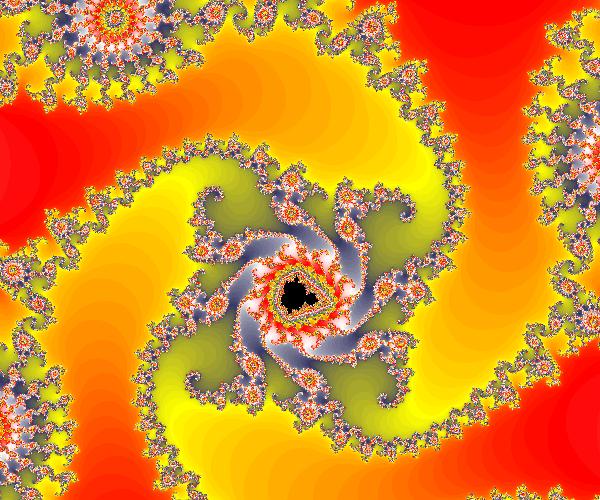
The black region is complex numbers c for which the sequence converges. You will notice that there are some outlying black areas. Zooming in reveals that there are many smaller black areas which cannot be seen in the initial diagram.
The other colours represent the "escape time": how many iterations of the sequence are required before zn becomes larger in magnitude than 2. The deep red surrounding the image initially shown on this page indicates that only one iteration was required. A slightly lighter red indicates two iterations. Up to around 25 iterations are shown here coloured in increasingly light gold. Other colours will become visible if you zoom in. The colours chosen are arbitrary, and you will be able to find many other examples of the Mandelbrot set coloured using schemes different from the one used here.
Ideally, you want to iterate the sequence for any point until it "escapes", or until you can prove that it will never escape. However, points close to the black areas may require thousands of iterations to find their escape number (and hence their colour). This becomes a computing time problem. As each pixel of the images used on this page has to have its colour computed (and when the width is set to 500 pixels there are 200,000 pixels in these images), the iteration depth has to be limited. In this program the default is 500. This means an average image may require 50 million evaluations of the equation zn+1 = zn2 + c.
 |  |
 |  |
If you want to return to your zoom, click the 'Full url' button, and copy or bookmark the url.
Your zoom as a copiable PNG:
![]()
Contact developer: apps@jakebakermaths.org.uk